Customer model
The customer model provides household electricity demand profiles under ‘baseline’ and intervention conditions. Profiles are generated from the household demand data collected from the SAVE sample for several customer types.
The customer types have been developed to represent the differing levels of household demand associated with several characteristics (household size, dwelling size and primary heating type). Intervention ‘impact’ profiles are generated to represent the treatment effects (change in electricity demand) observed under several SAVE trial conditions.
Network model
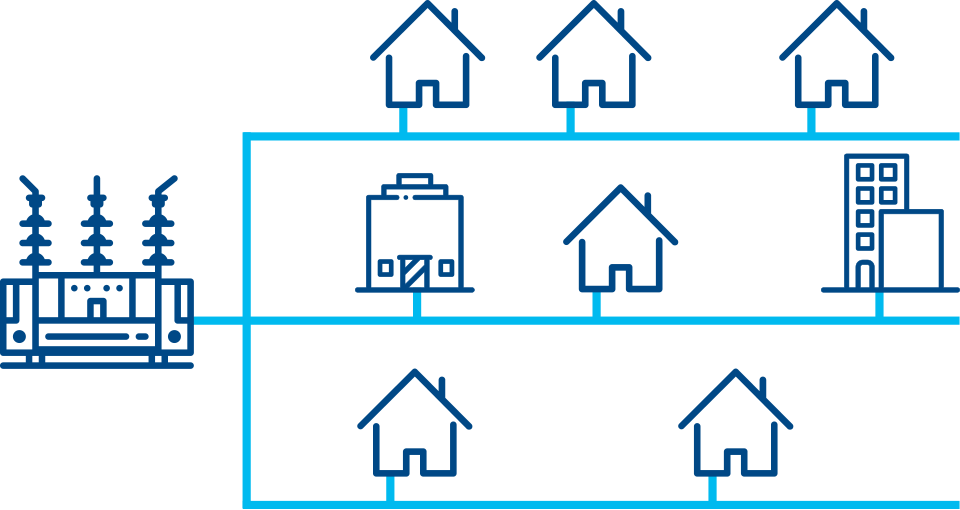
The network model allows a DNO to better understand existing and future loading on the distribution network and effectively manage network investment strategy. These strategies can comprise of traditional reinforcement methods but more importantly the tool also explore the feasibility of SAVE interventions (such as customer engagement, LEDs, ToU) to manage network constraints.
On completion the network model will interact with the customer model to allocate representative loads based on demographics of customers within the area in question. This allows planners to assess transformer and cables thermal capacity as well as network voltage profile with high confidence. The DNO can then run a range of growth scenarios (based on BEIS data,) and delve into their impact on the network. Should a network constraint be identified a planner can look to the pricing model to determine potential solutions to manage the constraint. SAVE’s network model has been designed and co-developed by project suppliers EA Technology.
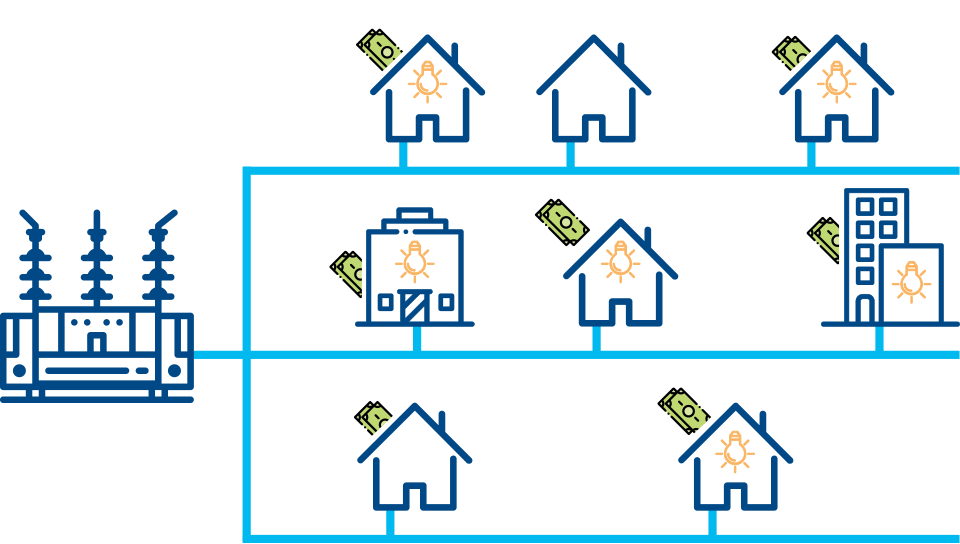
Pricing model
The pricing model uses data from assessments made in the Network Model which will highlight a given constraint on an area of the network, between current day and 50 years into the future based on forecasted future load.
The model applies SAVE interventions to the types of customer residing on the network in question and first determines whether such an intervention could manage the forecasted issue and then assess the cost of comparing smart interventions and traditional reinforcement i.e. larger cables/substations.
The model uses clever econometric techniques known as least regrets to manage risk in these scenarios and highlight the optimal solution for the network, the customer and wider society.
Network investment tool
SAVE’s Network Investment Tool (NIT) provides a cumulation of the projects trials and three models – the customer model, network model and pricing model into one central system. By layering distribution networks with census statistics, a DNO can use analysis from SAVE’s customer model:
- To understand how different demographics of customers consume electricity, and
- build up an accurate model of consumption on different parts of the electricity Network.
The DNO can then run forecasts of load-growth, for instance based on electric vehicle uptake. This would allow a DNO to understand how that part of the networks load may change, up to 50 years in the future.
In the event of an overload network signal the model can apply information on how different forms of customer respond to SAVE interventions. This information is essential to estimate the impact the customer can have in mitigating the forecasted overload.
By employing these data sets econometric analysis techniques are then applied to determine the cost-efficiency of these network areas compared with both traditional reinforcement and other smart interventions i.e. battery storage.
The Network Investment tool puts a DNO in a prime position to visualise, and manage, the network through the most cost-effective means, and in an optimal manner for society striving to minimise electricity bills for customers.